Year
2018
Skills / Software
Utilising infographics as a way to visualise a success story.
Taking a good customer story and making the most of it.

A visual story
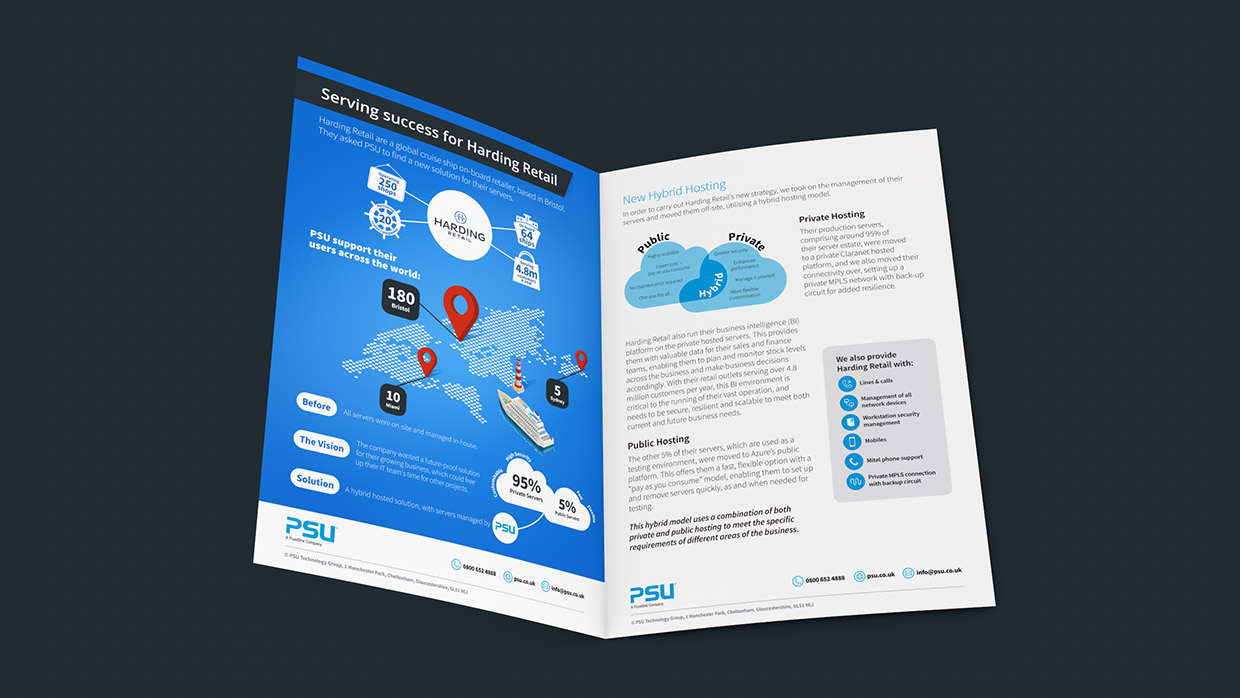
To improve upon our existing case study format, the concept to develop an infographic was proposed to illustrate key components of the "story" in a visually interesting and informative way.
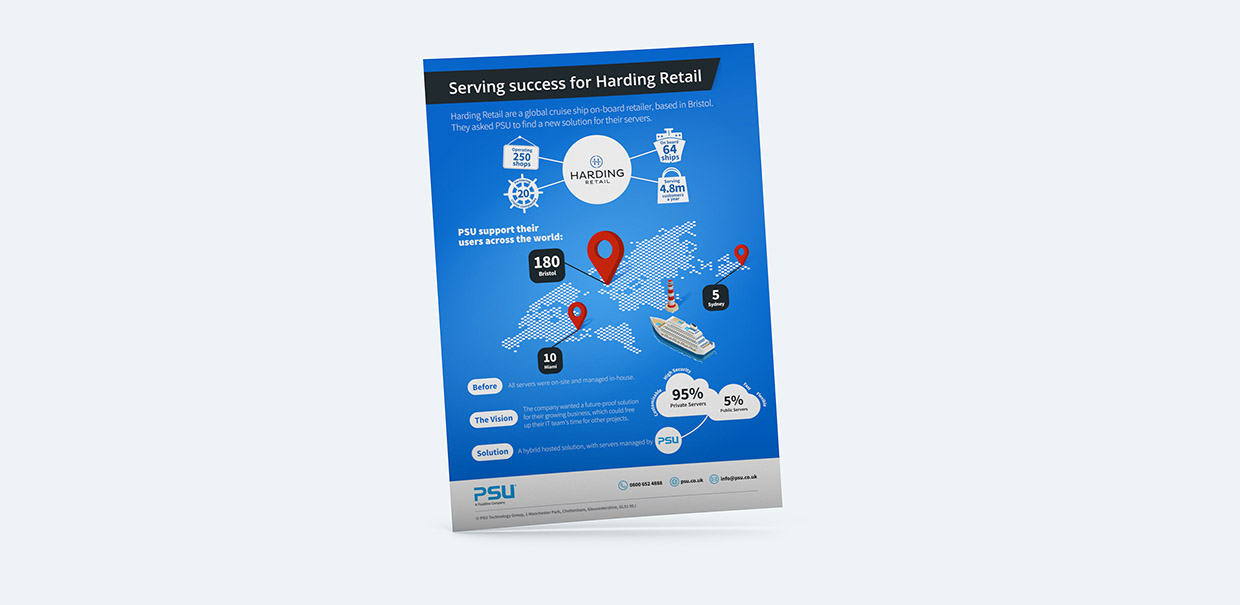
Eye-catching & informative
I produced an eye-catching infographic to be included in a case study that PSU could use to promote their IT services. The client also used it to promote his own work and we were told he managed to get himself a pay rise out of it!
Examples of other infographics I've created:
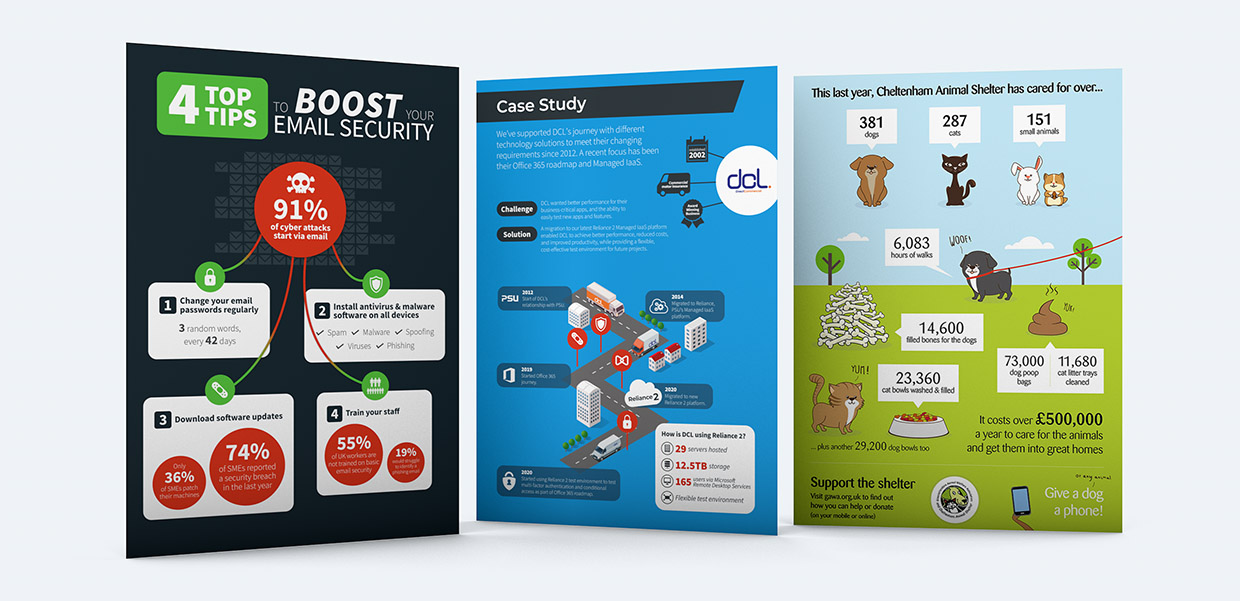
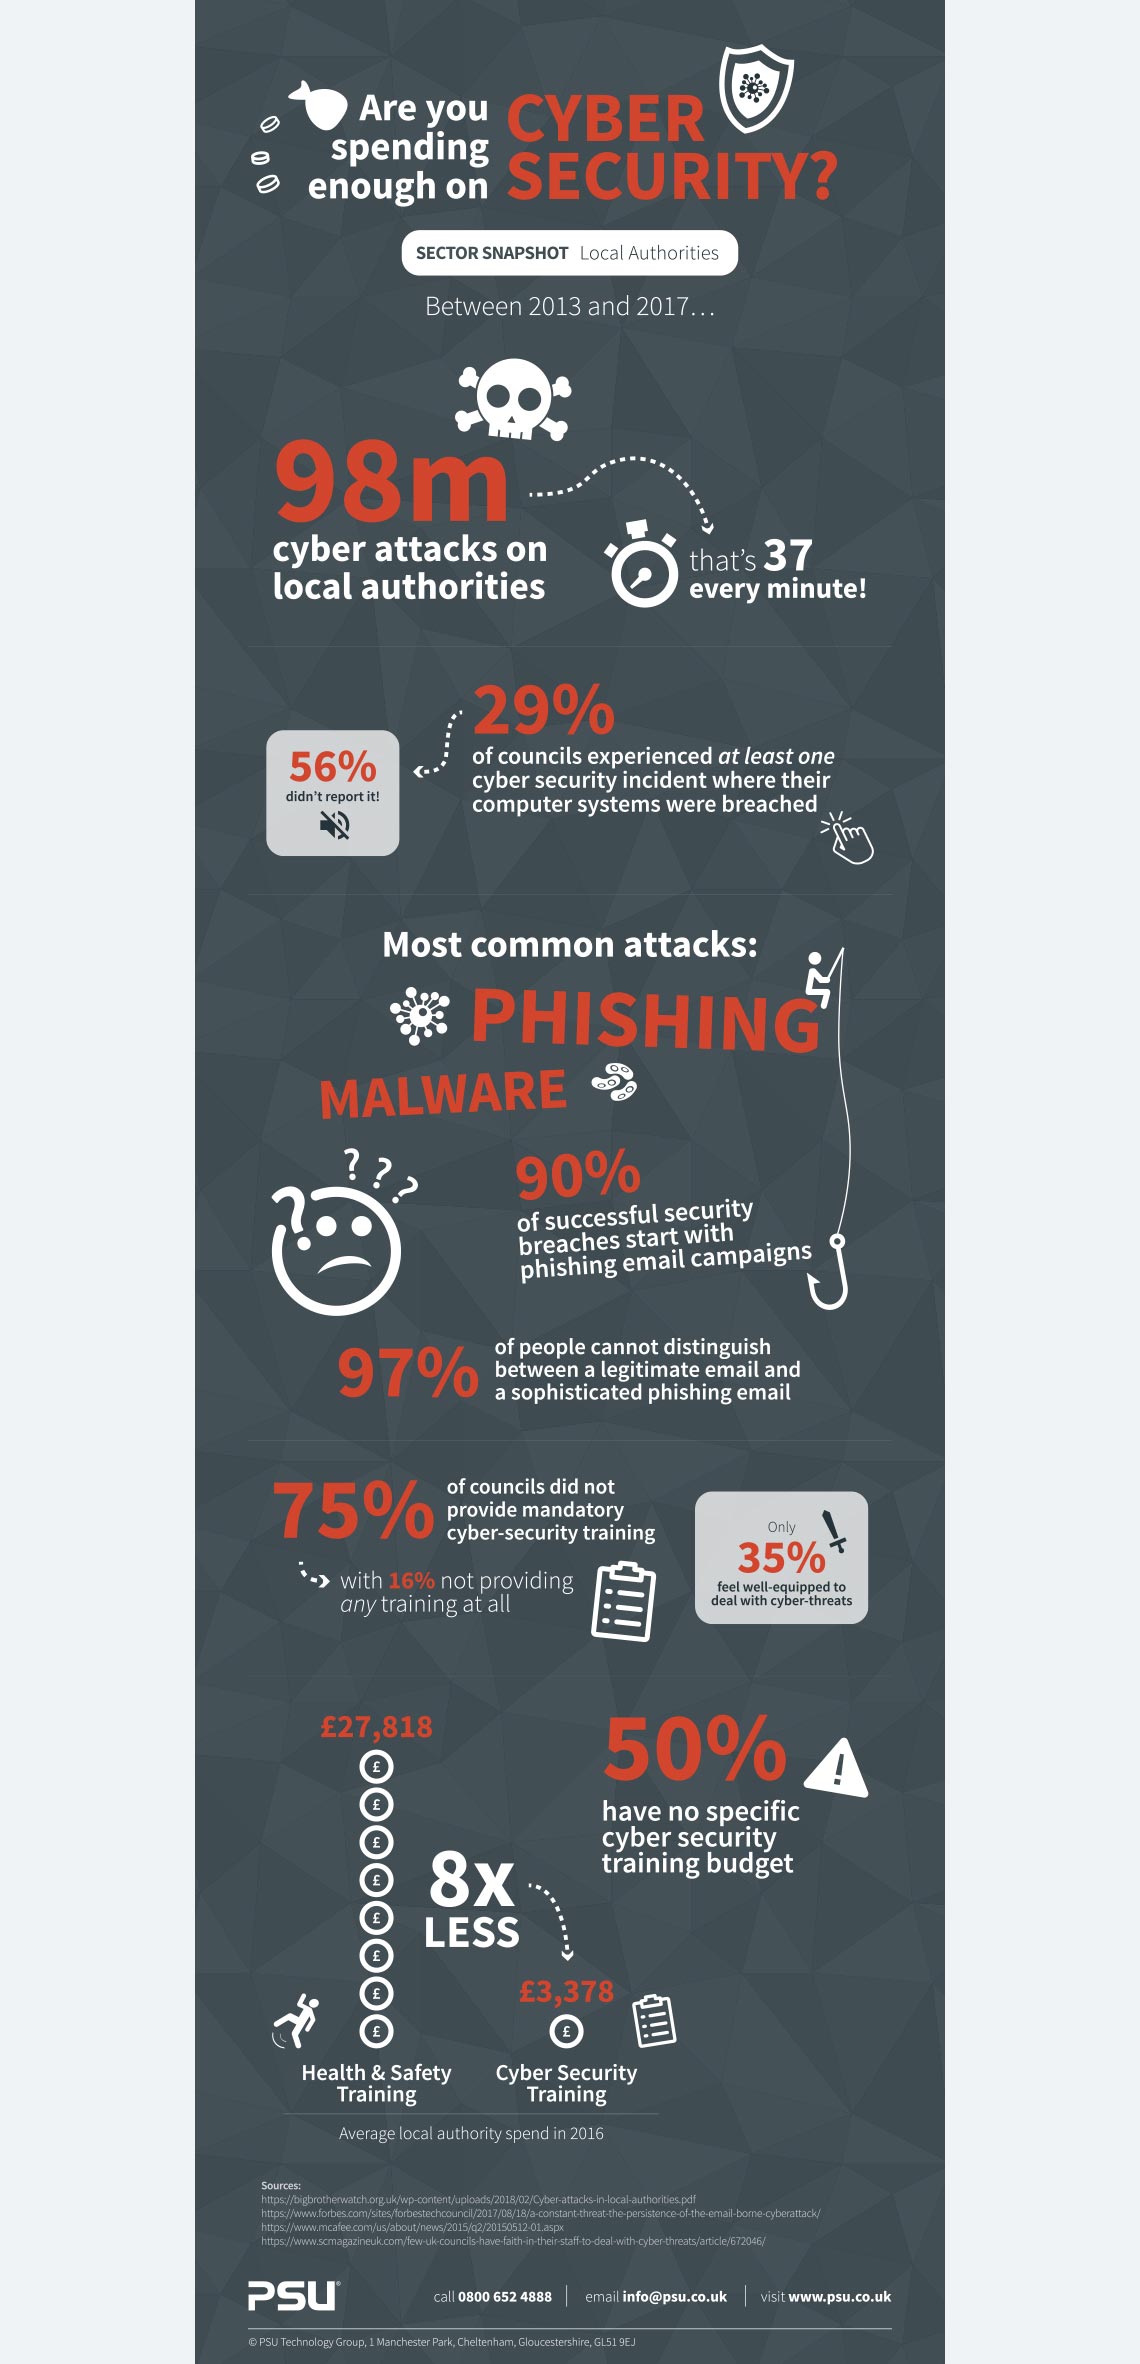
A fantastic way to visualise data
Infographics are a fantastic way to visualise data.
Personally, I enjoy creating them - as they generally allow me to be more creative in a corporate setting.